
Data Visualization
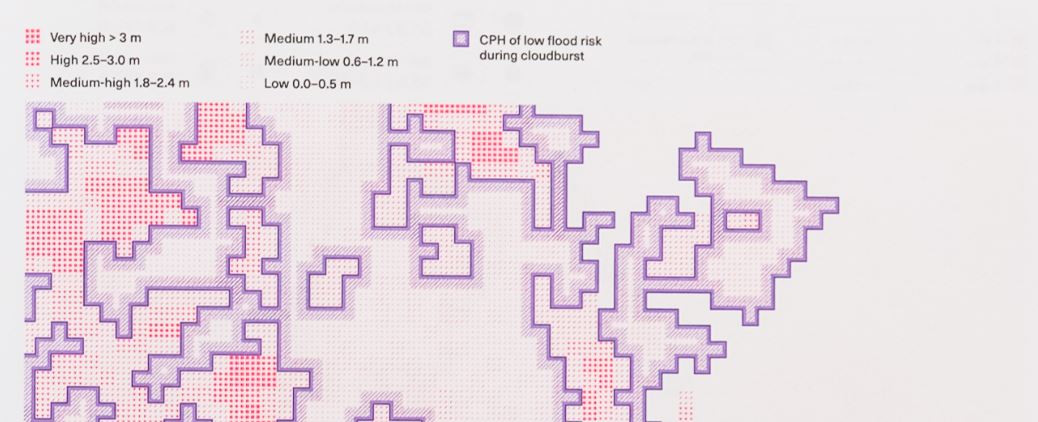
Data visualizations have the potential to make the invisible visible, the complex readable, and the abstract concrete. As the amount and use of data around us becomes more and more widespread, the ability to communicate with and through data has become an essential competence.
The increased use and understanding of data visualizations has also highlighted its shortcomings in a post-factual world. This has led to a critical reassessment of data visualizations resulting in a stronger emphasis on the accountability and transparency as a data communication format. It has also resulted in an exploration of alternative, more emotional forms of visualization.
The course provides both a practical and theoretical foundation for working with data visualizations. As a participant, you will amongst others be introduced to concrete methods for – as well as universal principles of – the visualization of data. At the same time, you will get to work hands-on creating data visualizations and infographics. You should expect to engage in a creative and critical dialogue around the communication with and through data, and to explore new tools and methods and to be actively creating visualizations during the course.
Learning outcomes:
- introduction to a variety of data visualization practices, their ideas and their tools
- theoretical understanding of the grammar and rules of (data) visualizations
- introduction and exercises in visualization software like Gephy, Charticulator, Tableau or P5 / D3.
Target group
Target group
Professionals in communication with some design experience who are interested in developing their skills in data visualisation. Relevant for all who want to work more with data in their processes, either as part of research, or as method of communication. The course assumes that participants have a basic knowledge and experience of working with design, visual design tools and communication. As the participants will do some tinkering with coding, they are expected to have some experience in working with spreadsheets.
Prerequisites
Prerequisites
- basic knowledge and experience of working with visual design tools basic
- knowledge and experience of working with spreadsheets
- up-to-date laptop with basic visual design software (for instance Adobe Creative Suite)
- the course will be taught in English
Guest lectures
Guest lectures
Gustavo Ribeiro, Associate Professor, Institute of Architecture, Urbanism and Landscape at Royal Danish Academy
Jichen Zhu, Associate Professor in Digital Design at IT University of Copenhagen
Annelie Berner, Designer and artistic researcher at Institute of Visual Design at Royal Danish Academy
Mauro Martino, Principal Researcher and Head of the Visual AI Lab, MIT-IBM Research AI and Professor of Practice at Northeastern University


